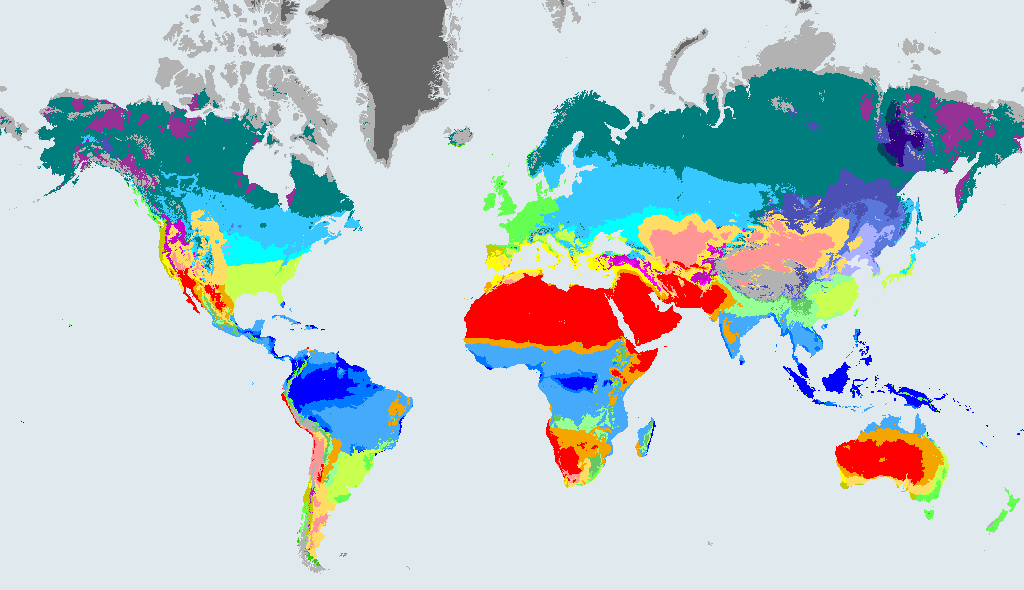
What a Cfa climate is like
Cfa Humid subtropical. No dry season. Summers are hot and sticky, winters are mild, and thunderstorms are common in the warm months.
The rules behind the code, in plain English:
- Temperate (coldest month between 0 °C and 18 °C).
- No dry season (neither a dry summer nor a dry winter as defined above).
- Hot summer: the warmest month averages 22 °C or more.
Dataset wording: "Temperate, no dry season, hot summer". In the maps of Beck et al. (2023) the class is written: C: Not B and Thot > 10 and 0 < Tcold < 18; f: Not Cs or Cw; a: Thot >= 22.
Humid subtropical climate has hot, humid summers and mild winters, with rain through the year. Summer afternoons are muggy and storm-prone, and winters are mild with the odd cold snap. Cotton, rice, soya beans, citrus and long-season crops grow well, and gardens stay green. Air conditioning is common, homes are built for heat and humidity, and people wear light fabrics for much of the year.
How much of the world is Cfa?
- 4.7%of the world's land outside Antarctica, 1991 to 2020
- 6,291,426 km²area, 1991 to 2020
- 4,956cities of 15,000 or more people (GeoNames) have this climate now
In 1901 to 1930 it covered 4.3% of that land, so its area then was 7.76% smaller than in 1991 to 2020.
How the Cfa area is projected to change by 2071 to 2099
These figures compare the area of Cfa in each future map with 1991 to 2020. They come from the Beck et al. (2023) model projections under three emissions scenarios. They show what the scenarios imply, not what will happen.
| Map | Share of land | Change in area vs 1991 to 2020 |
|---|---|---|
| 1901 to 1930 (past) | 4.3% | -7.76% |
| 1991 to 2020 (now) | 4.7% | - |
| 2071 to 2099, SSP1-2.6 (low emissions) | 5.5% | +17.43% |
| 2071 to 2099, SSP2-4.5 (middle of the road) | 6% | +29.53% |
| 2071 to 2099, SSP5-8.5 (high emissions) | 7.4% | +57.81% |
Shares are of land outside Antarctica. A negative change means the zone shrinks.
What happens to today's Cfa land
Of the land that is Cfa in 1991 to 2020, this is how much stays Cfa and where the rest ends up in 2071 to 2099, by scenario:
| Scenario (2071 to 2099) | Stays Cfa | Where the rest goes (biggest first) |
|---|---|---|
| SSP1-2.6, low emissions | 95% | Aw (1.2%), BSh (1%), Am (1%), Af (0.7%) |
| SSP2-4.5, middle of the road | 91% | Aw (2.4%), Am (1.9%), BSh (1.8%), Af (1.4%), BSk (0.7%) |
| SSP5-8.5, high emissions | 83% | BSh (4.1%), Aw (4%), Af (3.2%), Am (2.9%), Csa (1.2%) |
Looking back, 84% of today's Cfa land was also Cfa in 1901 to 1930. The rest was Cfb (5.4%), Dfa (3.4%), Cwa (2.8%), Dfb (2.6%), BSk (0.7%).
Where Cfa is found
The countries with the most Cfa land in 1991 to 2020:
| Country | Area | Share of all Cfa | Share of the country |
|---|---|---|---|
| United States | 2,151,295 km² | 34% | 23% |
| China | 1,344,672 km² | 21% | 14% |
| Argentina | 724,339 km² | 12% | 26% |
| Brazil | 490,820 km² | 7.8% | 5.8% |
| Australia | 335,606 km² | 5.3% | 4.4% |
| Japan | 203,107 km² | 3.2% | 55% |
| Uruguay | 172,664 km² | 2.7% | 98% |
| Paraguay | 130,419 km² | 2.1% | 33% |
Places with a Cfa climate today
The biggest cities in the 1991 to 2020 map that sit in Cfa (at most two per country):
- Shanghai, China
- Chongqing, China
- São Paulo, Brazil
- Tokyo, Japan
- New York City, United States
- Taipei, Taiwan
- Sydney, Australia
- New Taipei City, Taiwan
- Yokohama, Japan
- Durban, South Africa
- Buenos Aires, Argentina
- Brisbane, Australia
Other temperate climates (group C)
Frequently asked questions
What does Cfa mean in the Köppen climate classification?
Temperate (coldest month between 0 °C and 18 °C). No dry season (neither a dry summer nor a dry winter as defined above). Hot summer: the warmest month averages 22 °C or more. The code is a short way of writing that: the first letter is the major group (C, temperate) and the letters after it say more about rain and temperature.
What is a humid subtropical climate like?
Hot, humid summers and mild winters, with rain all year. No dry season. Summers are hot and sticky, winters are mild, and thunderstorms are common in the warm months.
How much of the world has a Cfa climate?
4.7% of the world's land outside Antarctica was Cfa in 1991 to 2020, about 6,291,426 km² (Beck et al. 2023, 1 km maps).
Will the Cfa climate zone grow or shrink?
Under the middle-of-the-road scenario (SSP2-4.5), the area of Cfa in 2071 to 2099 is 29.53% larger than in 1991 to 2020. This is a model projection, not a forecast, and it differs under other scenarios (see the table on this page).
Data: Beck et al. (2023), CC BY 4.0. See data sources and licences. Köppen-Geiger classes describe long-term averages, not weather.