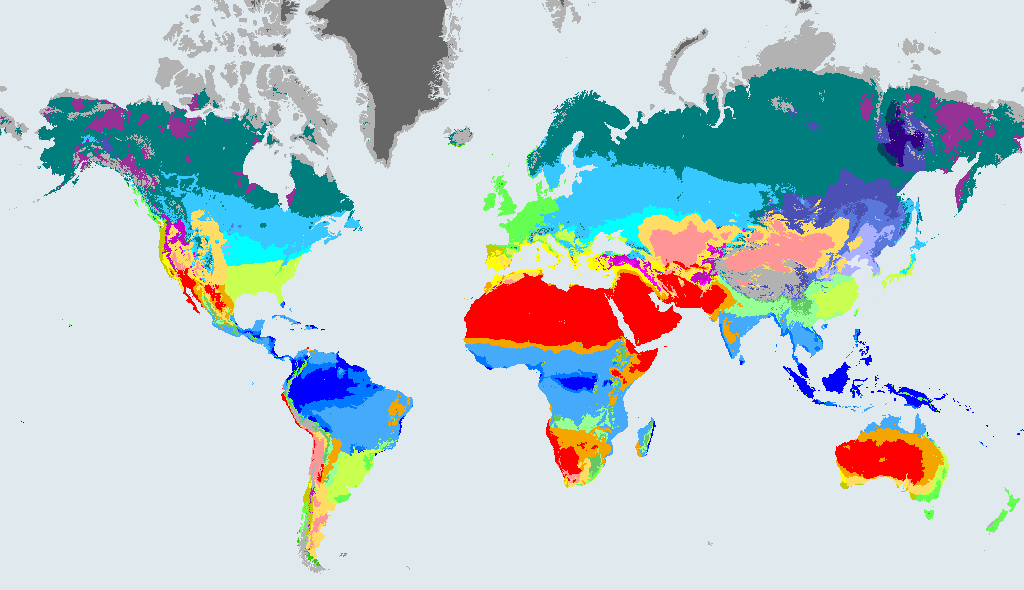
What a Am climate is like
Am Tropical monsoon. Heavy seasonal rains bring a monsoon, followed by a short drier period. The wet season is wet enough to keep forests growing through the dry months.
The rules behind the code, in plain English:
- Tropical (coldest month 18 °C or more).
- Not a rainforest: the driest month gets under 60 mm.
- But the dry month still gets at least 100 minus yearly rainfall divided by 25 (in mm).
Dataset wording: "Tropical, monsoon". In the maps of Beck et al. (2023) the class is written: A: Not B and Tcold >= 18; m: Not Af and Pdry >= 100 - MAP/25.
Tropical monsoon climate is hot all year, with a very wet season followed by a shorter, drier spell. The rains arrive in a rush and can flood fields and roads, then ease enough that the forest and farmland get a break. Monsoon forests, rice, tea and spices do well. Houses are built to shed heavy rain, and daily routines bend around the wet months.
How much of the world is Am?
- 3.6%of the world's land outside Antarctica, 1991 to 2020
- 4,879,657 km²area, 1991 to 2020
- 1,827cities of 15,000 or more people (GeoNames) have this climate now
In 1901 to 1930 it covered 3.9% of that land, so its area then was 7.26% larger than in 1991 to 2020.
How the Am area is projected to change by 2071 to 2099
These figures compare the area of Am in each future map with 1991 to 2020. They come from the Beck et al. (2023) model projections under three emissions scenarios. They show what the scenarios imply, not what will happen.
| Map | Share of land | Change in area vs 1991 to 2020 |
|---|---|---|
| 1901 to 1930 (past) | 3.9% | +7.26% |
| 1991 to 2020 (now) | 3.6% | - |
| 2071 to 2099, SSP1-2.6 (low emissions) | 3.9% | +7.88% |
| 2071 to 2099, SSP2-4.5 (middle of the road) | 4.1% | +13.18% |
| 2071 to 2099, SSP5-8.5 (high emissions) | 4.3% | +17.86% |
Shares are of land outside Antarctica. A negative change means the zone shrinks.
What happens to today's Am land
Of the land that is Am in 1991 to 2020, this is how much stays Am and where the rest ends up in 2071 to 2099, by scenario:
| Scenario (2071 to 2099) | Stays Am | Where the rest goes (biggest first) |
|---|---|---|
| SSP1-2.6, low emissions | 89% | Aw (8.4%), Af (2.1%) |
| SSP2-4.5, middle of the road | 88% | Aw (10%), Af (2.1%) |
| SSP5-8.5, high emissions | 79% | Aw (17%), Af (3.5%) |
Looking back, 87% of today's Am land was also Am in 1901 to 1930. The rest was Af (5.9%), Aw (5%), Cfa (1%).
Where Am is found
The countries with the most Am land in 1991 to 2020:
| Country | Area | Share of all Am | Share of the country |
|---|---|---|---|
| Brazil | 1,679,935 km² | 34% | 20% |
| Democratic Republic of the Congo | 398,793 km² | 8.2% | 17% |
| Colombia | 298,277 km² | 6.1% | 26% |
| Venezuela | 188,968 km² | 3.9% | 21% |
| Bolivia | 161,601 km² | 3.3% | 15% |
| Myanmar | 152,660 km² | 3.1% | 23% |
| Peru | 138,563 km² | 2.8% | 11% |
| Indonesia | 128,719 km² | 2.6% | 6.9% |
Places with a Am climate today
The biggest cities in the 1991 to 2020 map that sit in Am (at most two per country):
- Mumbai, India
- Abidjan, Ivory Coast
- Yangon, Myanmar
- Chattogram, Bangladesh
- Quezon City, Philippines
- Navi Mumbai, India
- Bandung, Indonesia
- Santo Domingo, Dominican Republic
- Port Harcourt, Nigeria
- Conakry, Guinea
- Camayenne, Guinea
- Benin City, Nigeria
Other tropical climates (group A)
Frequently asked questions
What does Am mean in the Köppen climate classification?
Tropical (coldest month 18 °C or more). Not a rainforest: the driest month gets under 60 mm. But the dry month still gets at least 100 minus yearly rainfall divided by 25 (in mm). The code is a short way of writing that: the first letter is the major group (A, tropical) and the letters after it say more about rain and temperature.
What is a tropical monsoon climate like?
Hot all year, with a very wet season and a short dry spell. Heavy seasonal rains bring a monsoon, followed by a short drier period. The wet season is wet enough to keep forests growing through the dry months.
How much of the world has a Am climate?
3.6% of the world's land outside Antarctica was Am in 1991 to 2020, about 4,879,657 km² (Beck et al. 2023, 1 km maps).
Will the Am climate zone grow or shrink?
Under the middle-of-the-road scenario (SSP2-4.5), the area of Am in 2071 to 2099 is 13.18% larger than in 1991 to 2020. This is a model projection, not a forecast, and it differs under other scenarios (see the table on this page).
Data: Beck et al. (2023), CC BY 4.0. See data sources and licences. Köppen-Geiger classes describe long-term averages, not weather.