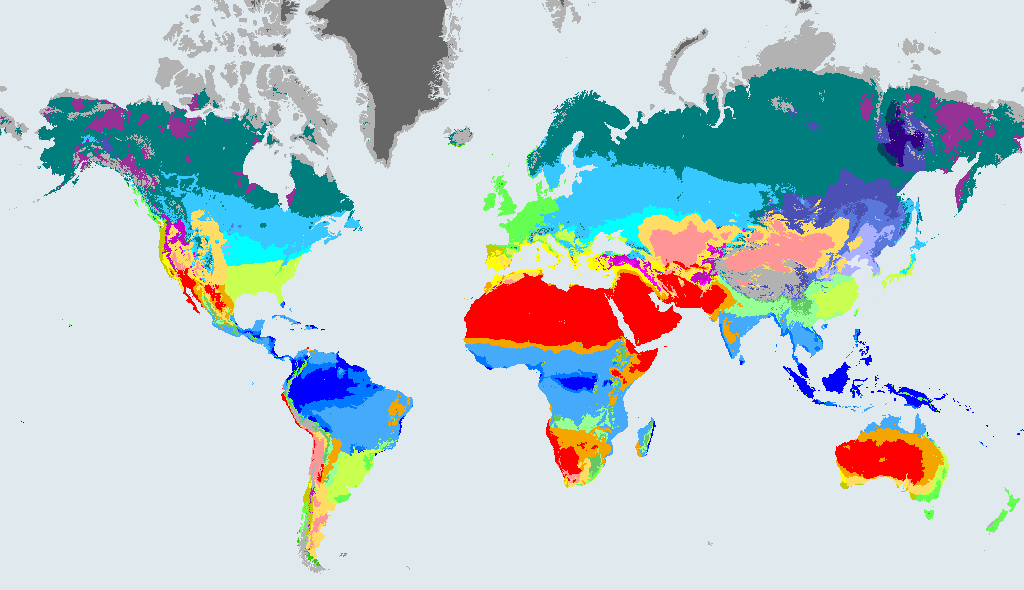
How to read the climate zone map
The map colours every bit of land by its Köppen-Geiger climate class, drawn from 1 km data (Beck et al. 2023). There are 30 classes in five major groups. The colours are the dataset's standard palette, so the map looks like the one in textbooks. Some of those colours are hard to tell apart for people with colour vision differences, so every class is also named in the key below the map and on every card, never by colour alone. A colour-blind-friendly palette is planned.
- A: Tropical. Warm all year round. There is no cold season, only wetter and drier ones. (22% of land outside Antarctica in 1991 to 2020)
- B: Arid. Dry climates, where evaporation could use up more water than the rain supplies. Hot or cold, they are defined by dryness first. (32% of land outside Antarctica in 1991 to 2020)
- C: Temperate. Mild winters and a real summer. Where people have settled in large numbers, this is often the group they have settled in. (13% of land outside Antarctica in 1991 to 2020)
- D: Cold (continental). A proper winter with the coldest month at or below freezing, followed by a summer warm enough for trees. Found in the middle and high latitudes of the northern hemisphere, far from the moderating sea. (27% of land outside Antarctica in 1991 to 2020)
- E: Polar. No real summer. Defined by cold rather than by rain. (6.3% of land outside Antarctica in 1991 to 2020)
The most common zones in 1991 to 2020 are BWh (hot desert, 16%), Aw (tropical savannah, 13%), Dfc (subarctic (boreal), 11%), Dfb (warm-summer humid continental, 7.5%) and BSh (hot semi-arid (steppe), 6.4%).
How to read the Köppen climate classification, letter by letter
The Köppen climate classification gives every place a short code of two or three letters. Each letter answers one question about the climate, so once you know the letters you can read a code at a glance.
The first letter is the major group, set by temperature and by how dry a place is:
- A (tropical): Not arid, and even the coldest month averages 18 °C or more.
- B (arid): Dry: yearly rainfall is below ten times a threshold that rises with temperature and depends on the season in which the rain falls.
- C (temperate): Not arid, the warmest month is above 10 °C, and the coldest month is between 0 °C and 18 °C.
- D (cold (continental)): Not arid, the warmest month is above 10 °C, and the coldest month is at or below 0 °C.
- E (polar): Not arid, and even the warmest month is no warmer than 10 °C.
The second letter is about rain. In the tropical (A), temperate (C) and cold (D) groups, f means rain falls in every season, s means a dry summer, w means a dry winter, and in tropical climates m means a monsoon: a very wet season with a short dry spell. In the arid group (B), W is desert and S is steppe, the drier grassland that sits on the edge of a desert. In the polar group (E), T is tundra and F is a permanent ice cap.
The third letter, where there is one, is about temperature. In arid climates, h is hot and k is cold. In temperate and cold climates, a is a hot summer, b a warm summer, c a cold, short summer and d (cold climates only) a very cold winter.
Three codes, read out loud
- Cfb, temperate oceanic, which is the zone of London and Bogotá in 1991 to 2020. Temperate (coldest month between 0 °C and 18 °C). No dry season (neither a dry summer nor a dry winter as defined above). Warm summer: the warmest month is under 22 °C, and at least four months are above 10 °C. More about Cfb.
- BWh, hot desert, which is the zone of Karachi and Cairo in 1991 to 2020. Arid, and dry enough to be a desert: yearly rainfall is below five times the threshold. Hot: mean annual temperature of 18 °C or more. More about BWh.
- Dfc, subarctic (boreal), which is the zone of Arkhangel’sk and Surgut in 1991 to 2020. Cold (coldest month at or below 0 °C). No dry season (neither a dry summer nor a dry winter as defined above). Cold summer: not hot or warm, and the coldest month is not below -38 °C. More about Dfc.
So a place that is Cfb is temperate (C), has no dry season (f) and a warm rather than hot summer (b). A place that is BWh is arid (B), dry enough to be a true desert (W) and hot (h). A place that is Dfc is cold (D), has no dry season (f) and a short, cool summer (c).
Who were Köppen and Geiger?
Wladimir Köppen was a Russian-born German climatologist and plant scientist who noticed that the plants growing in a place are a good guide to its climate. In the late nineteenth century he began sorting the world's climates by the temperature and rainfall that plants need, and he kept refining the scheme for decades. Rudolf Geiger, a German climatologist, later worked with him and updated the scheme, and the two names have been joined ever since. Scientists have kept improving the maps; the one on this climate zone map is the 2023 version of Beck and colleagues, drawn at 1 km.
What climate zone am I in?
Search a town or city, press Near me, or tap anywhere on the map. The card shows the zone under that spot in 1991 to 2020 with a plain description, then the zone in 1901 to 1930 and in 2071 to 2099 under each scenario, and a few places that share today's climate. For example, London is Cfb in 1991 to 2020. Your browser asks permission before Near me works, and your position stays on your device.
Use the controls under the map to switch between 1901 to 1930, 1991 to 2020 and 2071 to 2099, to choose a scenario and to make the colours stronger or fainter so the basemap shows through. Every view has its own link, and the Embed button gives code for your own page.
How the zones are projected to change by 2100
The three future maps cover 2071 to 2099, the end of the century. Compared with 1991 to 2020, the share of land outside Antarctica that is in a different class is 15% under SSP1-2.6 (low emissions), 24% under SSP2-4.5 (middle of the road) and 39% under SSP5-8.5 (high emissions). The share that moves to a different major group is 5.2%, 8.4% and 14%.
These are model projections for a "what if" pathway, not forecasts. The past map (1901 to 1930) is a reconstruction; 15% of land was in a different class then than in 1991 to 2020.
What the scenarios mean
The future maps depend on how much greenhouse gas people put into the air over the rest of the century, which nobody can know yet. So the dataset does not give one future. It gives a scenario for each of several pathways, called SSPs (Shared Socioeconomic Pathways), and runs climate models for each one. The number in a name such as SSP2-4.5 is the extra heat the pathway would trap by 2100, measured in watts per square metre; a bigger number is a warmer world.
- SSP1-2.6 (low emissions). A world that cuts emissions quickly and moves to cleaner energy. Climate zones shift the least.
- SSP2-4.5 (middle of the road). Emissions peak and fall later, and progress is patchy. This is the default on this site.
- SSP5-8.5 (high emissions). A fossil-fuel-heavy world with emissions that keep rising. Climate zones shift the most.
None of these is a prediction. They are "if this, then that" maps. The map for 2071 to 2099 is an average over those years, not a single future year, and it is compared with the 1991 to 2020 map from the same dataset.
Here are some places whose zone changes in the data:
- London is Cfb (temperate oceanic) in 1991 to 2020, stays Cfb under SSP2-4.5 and Cfa (humid subtropical) under SSP5-8.5.
- Reykjavik is Cfc (subpolar oceanic) in 1991 to 2020, becomes Cfb (temperate oceanic) under SSP2-4.5 and Cfb (temperate oceanic) under SSP5-8.5.
- Moscow is Dfb (warm-summer humid continental) in 1991 to 2020, stays Dfb under SSP2-4.5 and Dfa (hot-summer humid continental) under SSP5-8.5.
Search any town on the map to see its own answer under each scenario.
Browse climate zones, countries and cities
Each of the 30 zones has a page describing it in plain English, with where it is found and how its area changes. There are pages for 234 countries and territories and for the 1,000 biggest cities, each with "cities with the same climate".
All 30 climate zones · Climate zones by country · City climates
From climate to sea level
Climate zones shift as the world warms. The same map family shows how sea level and ice have changed over time.
Where the data comes from and how far to trust it
Climate classes are from Beck et al. (2023), High-resolution (1 km) Köppen-Geiger maps for 1901 to 2099 based on constrained CMIP6 projections, Scientific Data 10, 724 (Figshare version 2), licence CC BY 4.0. Cities are from GeoNames and country outlines from Natural Earth. Every number on this site is worked out from those files by a script that runs the same way each time. See all data sources and licences.
A pixel is about 1 km across, so a tap near a class boundary or a coast can differ from the cell next door. Köppen-Geiger classes describe long-term averages, not weather or a forecast.
Frequently asked questions
What climate zone am I in?
Type your town into the search box on the map, press Near me, or tap your spot on the map. The card gives your Köppen-Geiger zone for 1991 to 2020, in words as well as a code, plus what it was in 1901 to 1930 and what it becomes by 2071 to 2099 under three emissions scenarios.
What is the Köppen climate classification?
It is a way of sorting the world's climates into named zones using only average monthly temperature and rainfall. Wladimir Köppen devised it in the late nineteenth century and Rudolf Geiger later refined it, which is why it is also called the Köppen-Geiger system. This site uses the 2023 version of Beck et al., which has 30 classes in 5 major groups.
What do the letters in a Köppen code mean?
The first capital letter is the major group: A tropical, B arid, C temperate, D cold (continental), E polar. A second letter says how dry (for B: W desert, S steppe) or when the rain falls (for A, C and D: f no dry season, s dry summer, w dry winter, m monsoon; for E: T tundra, F ice cap). A third letter, where there is one, says how hot the summer or how cold the winter is.
How many climate zones are there?
The Köppen-Geiger system used here has 30 classes, grouped into 5 major groups: tropical, arid, temperate, cold (continental), polar. Every zone has its own page, listed on the all climate zones page.
What climate zone is the UK?
Most of the UK is Cfb (temperate oceanic), covering 97% of its classified land in 1991 to 2020, with Cfc (subpolar oceanic) next at 3.1%. That is the mild, damp, no-extremes climate that gives Britain its changeable weather.
What climate zone is the US?
There is no single answer. The biggest US zone in 1991 to 2020 is Cfa (humid subtropical) at 23% of its classified land, but BSk (cold semi-arid (steppe)) (17%), Dfb (warm-summer humid continental) (14%), Dfa (hot-summer humid continental) (14%) also cover large areas. The country runs from hot desert and small tropical areas in the south to subarctic and tundra in the north.
What is a humid subtropical, Mediterranean or temperate oceanic climate?
They are three of the 30 zones. A humid subtropical climate (Cfa (humid subtropical)) has hot, humid summers and mild winters with rain all year. A Mediterranean climate (Csa (hot-summer mediterranean) and Csb (warm-summer mediterranean)) has dry summers and mild, wetter winters. A temperate oceanic climate (Cfb (temperate oceanic)) is mild and damp with no extremes. Each has its own page, linked below.
How accurate is the map?
Each map pixel is about 1 km across, based on climate averages for 1991 to 2020 in the dataset of Beck et al. (2023). A spot on a hill, a coast or a class boundary can differ from the town's usual label. For example, the 1 km data puts Madrid in BSk (cold semi-arid (steppe)) in 1991 to 2020, although many sources call it a Mediterranean climate. We show the data's answer.
Will my climate zone change?
Possibly. The projections for 2071 to 2099 show 15% of land outside Antarctica in a different zone under the low-emissions scenario (SSP1-2.6), 24% under the middle one (SSP2-4.5) and 39% under the high one (SSP5-8.5). Search your town to see its own answer under each. These are what-if projections, not forecasts.
Does the map show weather or a forecast?
No. Köppen-Geiger classes are based on long-term averages of monthly temperature and rainfall, not on weather on any one day. The future maps are model projections for a chosen emissions pathway, not predictions.
Zone pages mentioned above: humid subtropical climate (Cfa), hot-summer Mediterranean (Csa), warm-summer Mediterranean (Csb) and temperate oceanic climate (Cfb).
Climate classes: Beck et al. (2023), CC BY 4.0. See data sources and licences.