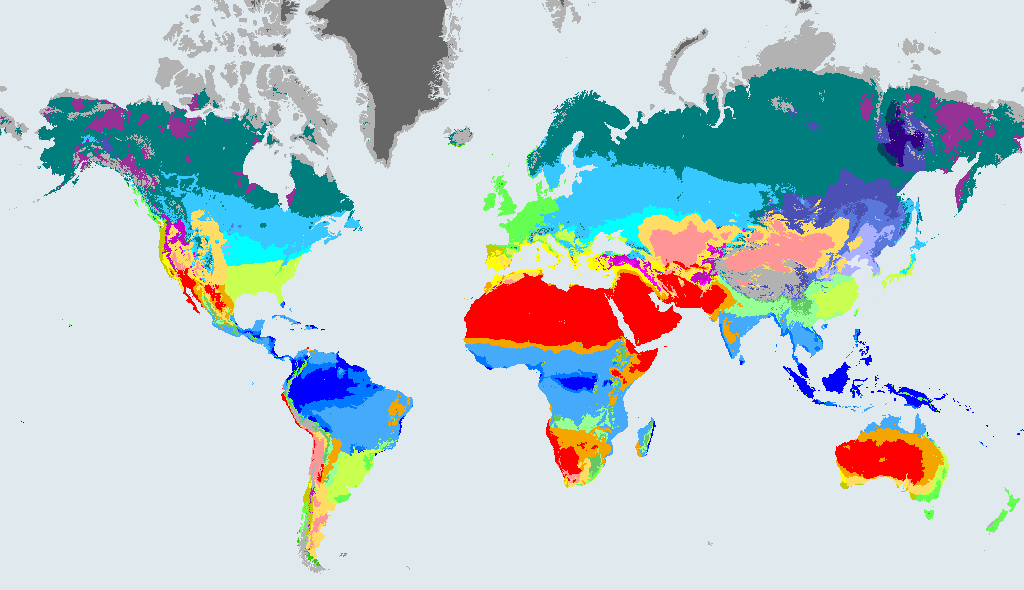
What a ET climate is like
ET Tundra. Treeless land where the warmest month still stays below 10 °C but rises above freezing. Low plants, mosses and lichens survive; the ground may be frozen beneath.
The rules behind the code, in plain English:
- Polar (warmest month no warmer than 10 °C).
- Tundra: the warmest month is above 0 °C.
Dataset wording: "Polar, tundra". In the maps of Beck et al. (2023) the class is written: E: Not B and Thot <= 10; T: Thot > 0.
Tundra climate is too cold for trees, with a brief, chilly summer and a long, freezing winter. The ground beneath is often permanently frozen, and the surface thaws only in summer, turning into boggy ground with moss, lichen, grasses and low shrubs. No crops grow, and people have traditionally relied on hunting, fishing and herding. Warm, windproof layers are needed in every month.
How much of the world is ET?
- 5%of the world's land outside Antarctica, 1991 to 2020
- 6,774,606 km²area, 1991 to 2020
- 17cities of 15,000 or more people (GeoNames) have this climate now
In 1901 to 1930 it covered 6.1% of that land, so its area then was 20.62% larger than in 1991 to 2020.
How the ET area is projected to change by 2071 to 2099
These figures compare the area of ET in each future map with 1991 to 2020. They come from the Beck et al. (2023) model projections under three emissions scenarios. They show what the scenarios imply, not what will happen.
| Map | Share of land | Change in area vs 1991 to 2020 |
|---|---|---|
| 1901 to 1930 (past) | 6.1% | +20.62% |
| 1991 to 2020 (now) | 5% | - |
| 2071 to 2099, SSP1-2.6 (low emissions) | 3.7% | -25.61% |
| 2071 to 2099, SSP2-4.5 (middle of the road) | 3% | -39.79% |
| 2071 to 2099, SSP5-8.5 (high emissions) | 2% | -60.26% |
Shares are of land outside Antarctica. A negative change means the zone shrinks.
What happens to today's ET land
Of the land that is ET in 1991 to 2020, this is how much stays ET and where the rest ends up in 2071 to 2099, by scenario:
| Scenario (2071 to 2099) | Stays ET | Where the rest goes (biggest first) |
|---|---|---|
| SSP1-2.6, low emissions | 72% | Dfc (17%), Dwc (6%), Dsc (2.4%), BSk (0.9%), Cfc (0.7%) |
| SSP2-4.5, middle of the road | 56% | Dfc (25%), Dwc (9.9%), Dsc (4.3%), BSk (1.4%), Cfc (1.3%) |
| SSP5-8.5, high emissions | 33% | Dfc (33%), Dwc (15%), Dsc (7.1%), Dwb (3.3%), BSk (2.6%) |
Looking back, 97% of today's ET land was also ET in 1901 to 1930. The rest was EF (1.9%).
Where ET is found
The countries with the most ET land in 1991 to 2020:
| Country | Area | Share of all ET | Share of the country |
|---|---|---|---|
| Canada | 1,754,693 km² | 26% | 18% |
| China | 1,695,367 km² | 25% | 18% |
| Russia | 1,147,186 km² | 17% | 6.8% |
| Greenland | 505,947 km² | 7.4% | 24% |
| United States | 270,940 km² | 4% | 2.9% |
| Peru | 243,469 km² | 3.6% | 19% |
| Chile | 160,314 km² | 2.4% | 22% |
| Argentina | 113,859 km² | 1.7% | 4.1% |
Places with a ET climate today
The biggest cities in the 1991 to 2020 map that sit in ET (at most two per country):
- La Paz, Bolivia
- Cerro de Pasco, Peru
- Huancavelica, Peru
- Nagqu, China
- Nuuk, Greenland
- Longyearbyen,
- Stanley, Falkland Islands
- Port-aux-Français, French Southern and Antarctic Lands
- Grytviken, South Georgia and the South Sandwich Islands
Other polar climates (group E)
Frequently asked questions
What does ET mean in the Köppen climate classification?
Polar (warmest month no warmer than 10 °C). Tundra: the warmest month is above 0 °C. The code is a short way of writing that: the first letter is the major group (E, polar) and the letters after it say more about rain and temperature.
What is a tundra climate like?
Too cold for trees; a brief, chilly summer. Treeless land where the warmest month still stays below 10 °C but rises above freezing. Low plants, mosses and lichens survive; the ground may be frozen beneath.
How much of the world has a ET climate?
5% of the world's land outside Antarctica was ET in 1991 to 2020, about 6,774,606 km² (Beck et al. 2023, 1 km maps).
Will the ET climate zone grow or shrink?
Under the middle-of-the-road scenario (SSP2-4.5), the area of ET in 2071 to 2099 is 39.79% smaller than in 1991 to 2020. This is a model projection, not a forecast, and it differs under other scenarios (see the table on this page).
Data: Beck et al. (2023), CC BY 4.0. See data sources and licences. Köppen-Geiger classes describe long-term averages, not weather.